Working with AI
When the Built-In Airtable Dashboard Can't Answer the Question
Airtable's route to letting a wider group see a base is the Portals add-on, billed every year. This client did not pay it. I built a read-only dashboard on Cloudflare instead, for a hosting bill that rounds to nothing, and it answers the questions Airtable's own dashboard could not.
11 Jun 2026 · 5 min read · By Sophie Kazandjian
Anyone who builds in Airtable knows the wall: the records are all there, and the question you actually have still has no answer on the screen.
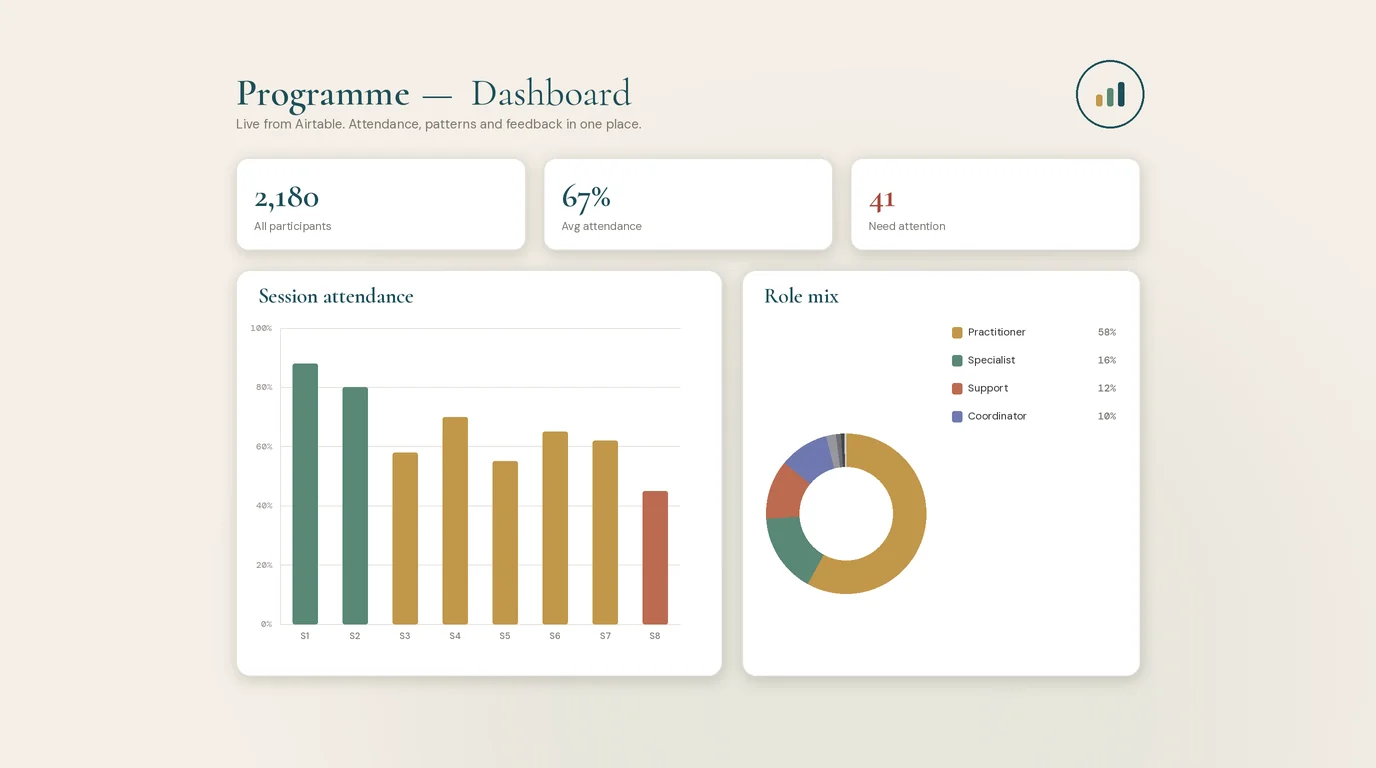
A client came to me with a database that worked perfectly well and still left the team stuck. The records lived in Airtable, the sort of base that ships with a dashboard and draws tidy charts, and the questions the team actually cared about went unanswered inside it. Everything was already in there. The answers simply had to be worked out instead of looked up.
They wanted to follow a single measure from one intake to the next, where each intake was its own separate set of records. Whether a particular person had shifted between their first answers and their later ones was another question, and reaching it meant lining up two records the base treated as unrelated. Pages of written comments held themes nobody had time to read through. Under all of it ran the standing wish for a clean one-page summary of any group, produced the moment someone asked rather than assembled by hand.
When the answer has to be worked out
Dashboards show what a base already holds. They start to strain the moment an answer has to be calculated instead of displayed, when two sets of records need joining, or a hundred replies need reading to find the thread they share. The work lived in that gap, between what a base can store and what a team needs to know.
The view I built on top of the base
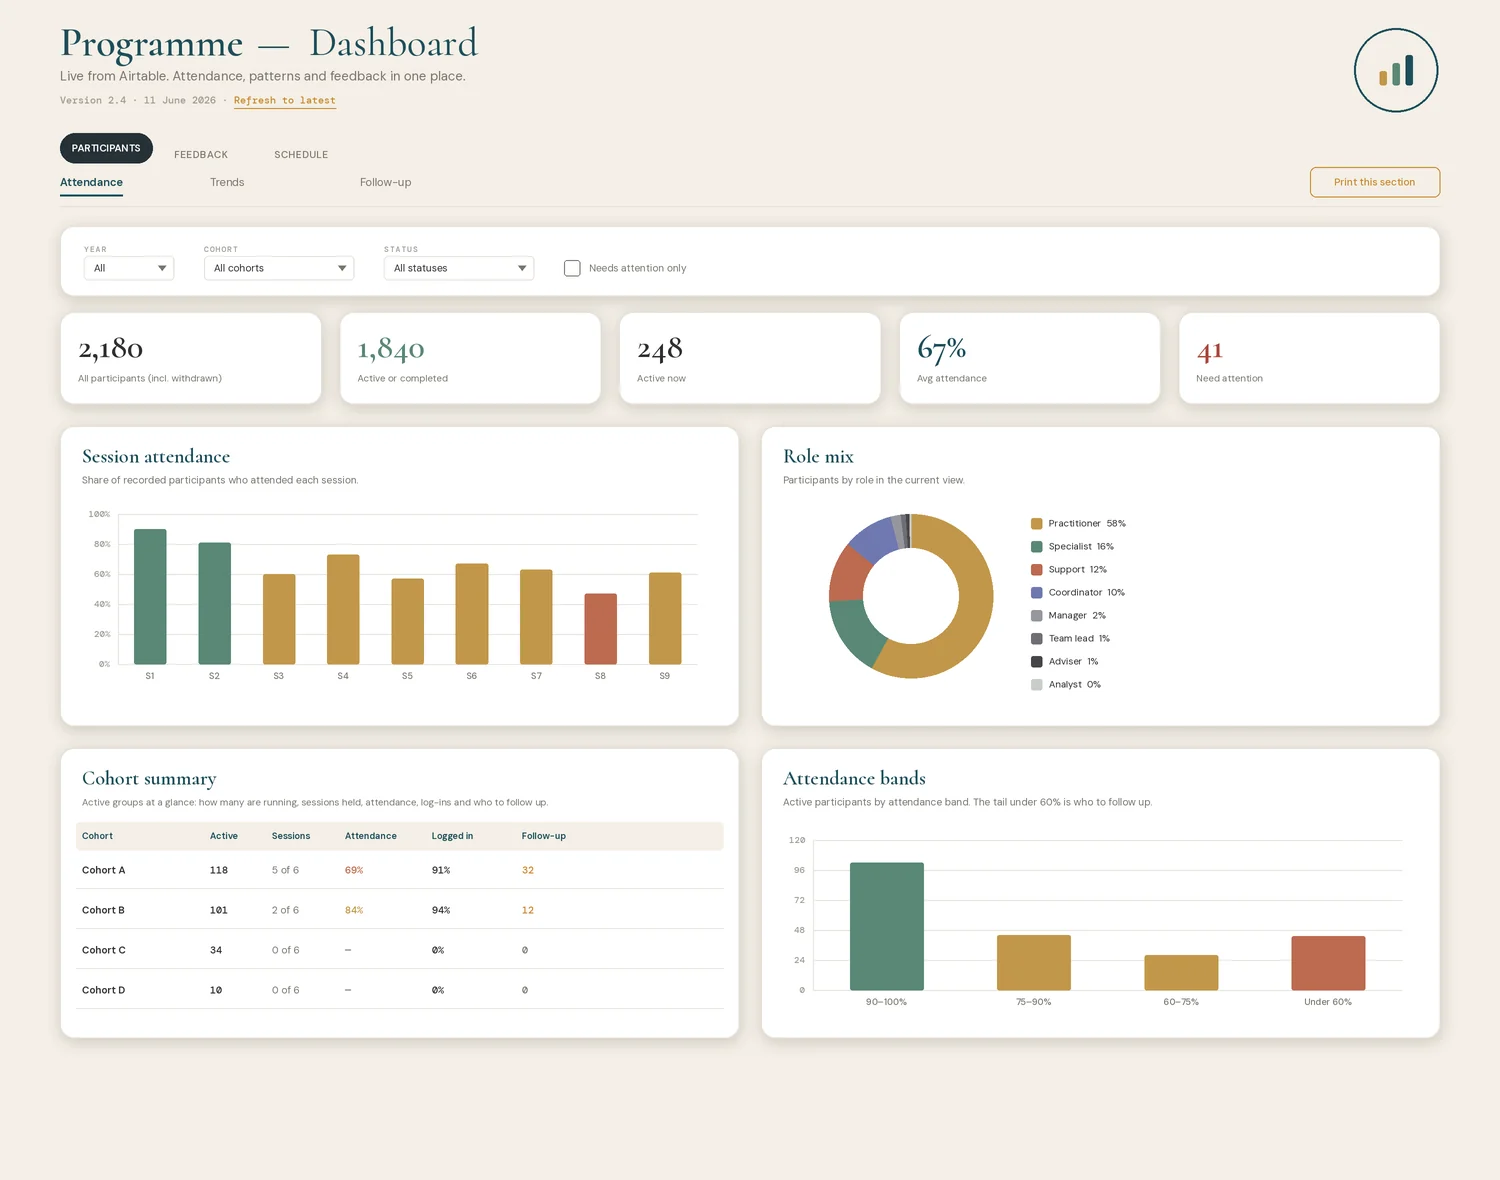
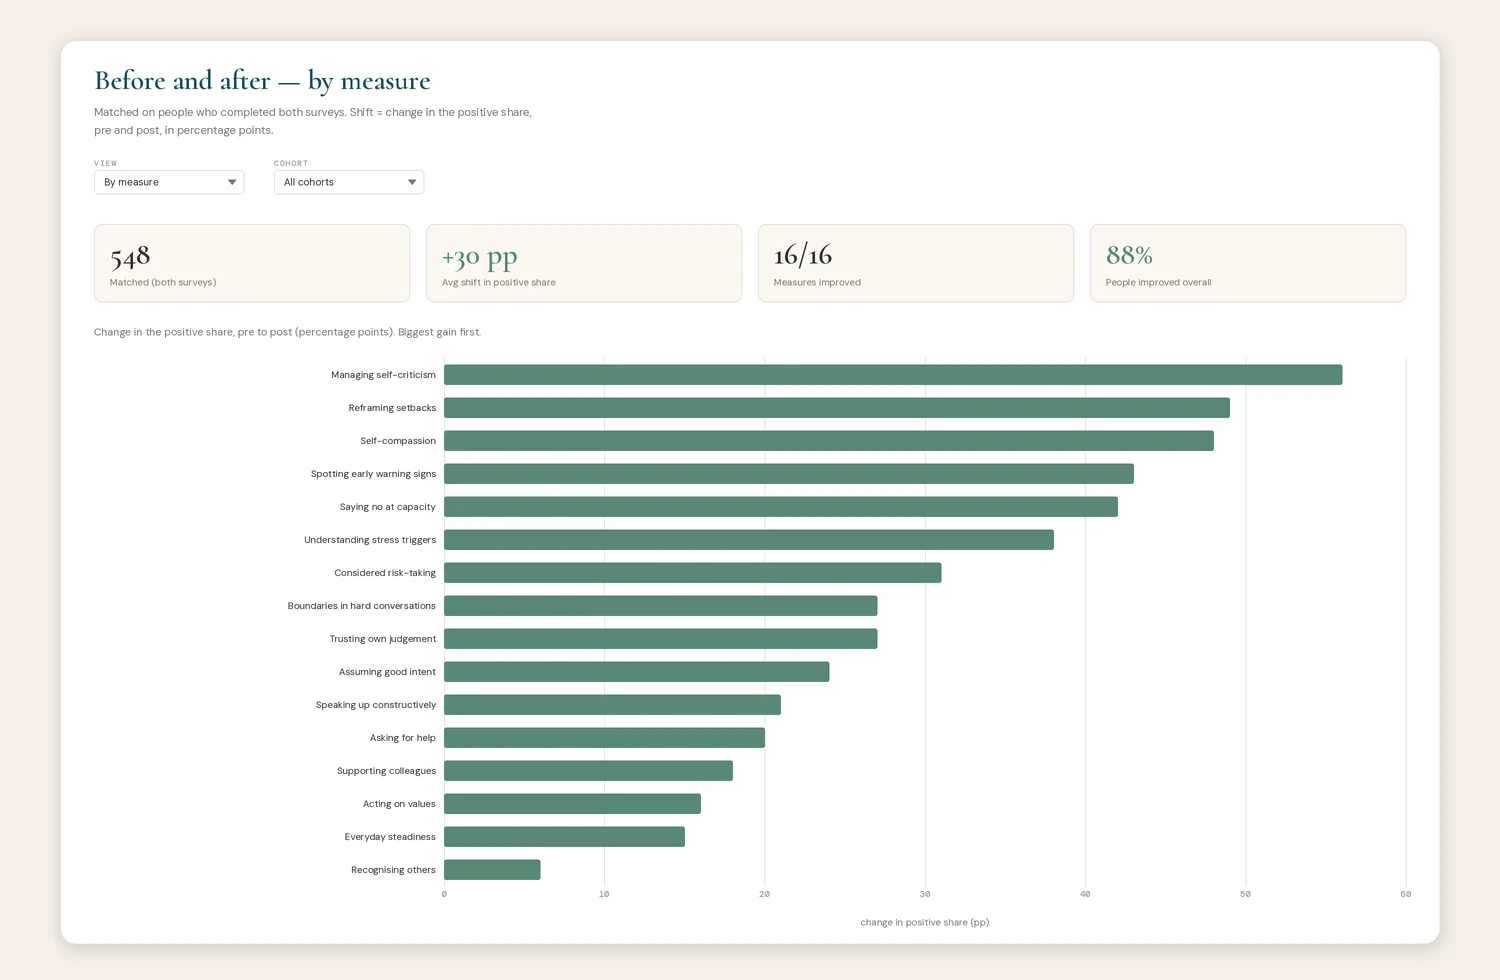
So I built a separate view that sits over the same base and reads from it live: a small web app of four or five plain sections, each handling one thing the native dashboard could not. One section follows a measure across intakes instead of inside a single one. Another sets each person's earlier answers beside their later ones, so what shows on screen is movement, not a single snapshot. The written responses get read and grouped by recurring theme. Choose a group, and a branded one-page summary appears, ready to print.
It carries the client's identity throughout, down to the loading icon that turns while a figure is being worked out. Branding is the easy half of that. Because the layer is built rather than themed, the palette, the typography and the way it reflows on a phone are all open to design, where an Airtable interface gives you its layout and a slot for a logo. Nothing is re-keyed; open the app and it shows whatever the base holds at that moment.
The code was the fast part
Claude Cowork wrote almost all of the code. The part I kept was deciding what each number actually meant, and that turned out to be most of the job, far more than the footnote it sounds like.
A model builds whatever you describe, and it will sometimes build the wrong thing without any sign that something is off. An early version of one measure joined records on the wrong field and produced numbers that looked perfectly reasonable and were wrong. Another counted the wrong people, until we pinned down exactly who belonged in a group and who did not. The before-and-after comparison only began working once I had said what improvement meant in this setting, and which people it should be measured on. None of that is a coding problem. It is knowing the work well enough to catch a figure that renders cleanly and is still wrong.
Without that person in the loop, the dashboard still renders, still looks finished, and is wrong in ways no one notices until a decision has already been built on it.
The reports that used to be built by hand
The same team produced a steady stream of formatted reports off the back of this data. One kind summarised a whole group, the headline movement and the figures behind it. The other was personal, one report per participant, showing how a single person had shifted over the programme. Both were built by hand in PowerPoint, a slide at a time, by reading numbers off one screen and typing them onto another.
The app now writes them. Choose a group and a branded report downloads, already populated. Search for a person and their individual report comes down the same way: their own before-and-after, the rating they gave, the topics they marked most useful, set against their group's headline figures. The decks are assembled in the browser from the live base at the moment you ask, so nothing is re-keyed and nothing leaves for a separate service. They match the templates the team already used, down to the typeface, the colour and the logo, so what arrives looks like their own work because it is.
The construction was, again, the quick half. The slow half was deciding what each report should say. Which movements count as real change and which were already there. How a thin set of results should sit on the page so it still reads as a finished report rather than a half-empty one. What to show when someone left a field blank. The template gives you the tidy example. The work was making it true for everyone the data runs through, not just the person it was first drawn around.
Where it runs
The hosting was the easy part. The whole thing runs on Cloudflare, pushed live with Wrangler and sitting behind Cloudflare Access, so only named people get in and everyone else meets a login screen. It reads through a key with permission to read and nothing more, and it costs almost nothing to run.
A note my regular readers will expect. The stack here is American end to end. Airtable was already holding the records when I arrived, Cloudflare does the hosting, and the code came out of Claude. Left to my own preferences I would have built on ground closer to home, on a European base like SeaTable and an EU-residency stack. The records were where they were, though, the new layer only reads from them, and the access controls keep that exposure narrow and named to a few people. It is the kind of compromise the work turns up more often than the principles would like.
What the paid route would have cost
Airtable does sell a way to open a base to people beyond the core seats. It is an add-on called Portals, billed on top of the plan the client already holds. The catch is the floor. Buying in at all means covering fifteen external guests, which for this team came to around $1,440 a year on top of everything else, and it renews. A team that needs three logins still pays for fifteen.
The free route, a public share link, was off the table from the start. These are participant records, and a link anyone can open is the wrong home for data about named people. So the real choice was between two safe options: rent the capability from Airtable every year, or build the reading layer once and host it for a bill that rounds to nothing. The Cloudflare version does the same job the add-on would have, with named access and branded, filtered views, and the cost holds steady as the team grows. What I avoided in hosting fees barely registers. The saving that counts is the yearly minimum the client would otherwise carry just to see their own data.
What still needs minding
The app only reads. The base stays the single source of truth and the one place anyone makes a change, which is where editing belongs. The joins and the matched comparisons rest on the conventions we settled in the records, so if a label drifts or a field gets reworded, a figure can stop lining up without saying so. A look over it now and then keeps the numbers straight.
What the team has now is a dashboard they can interrogate themselves, without going through me or a developer. They narrow to a cohort or a single intake, filter down to whichever group they care about, and the one-page summary rebuilds on screen in front of them. Someone who has never opened a line of code can pull the exact view they need and act on it that afternoon.
FAQs
- Can you build a custom dashboard on top of Airtable?
- Yes. Airtable's own interfaces are good at showing what a table holds and less good at answers that have to be calculated, like change across separate intakes or a matched before-and-after on the same people. A small web app that reads the base through its API can do that work and present it however the team needs, while the base stays the place where data is edited.
- Is it safe to host a client dashboard on Cloudflare?
- This one is tightly controlled. It sits behind Cloudflare Access, so only named people reach it, and it reads through a key scoped to read only, so the app cannot change anything in the base. Running costs are negligible. The harder questions are about jurisdiction rather than access, which the piece above gets into.
- Did AI build the whole thing?
- Claude Cowork wrote almost all of the code. What it could not do was decide what each number meant, which records to match, or who counted as improved. Those definitions came from knowing the work, and every figure was checked against the source before it was trusted.
- Is there a cheaper alternative to Airtable Portals for sharing data with a wider team?
- Often, yes. Portals is Airtable's route to giving people outside the core seats a controlled view, and the smallest tier covers fifteen external guests, billed yearly on top of your plan, whether you need fifteen or three. Where the data is sensitive, a public share link is not a safe substitute. A read-only web app that sits over the base behind access control does the same job for a hosting cost that rounds to nothing, and it does not climb as the team grows. The build is a one-off; after that there is no per-guest charge.
- Can the dashboard produce the reports as well as the figures?
- Yes. Alongside the on-screen views, the app generates finished, branded report files on demand, both a group summary and an individual report for a single participant, populated from the live base and matching the templates the team already used. They are built in the browser when asked, so there is no extra service to run and the data stays where it is. As with the figures, the careful part was the definitions: what each report should show, and how it should hold together when someone's results are thin.