Case Studies
How Claude Created a Branded PowerPoint Slide from My Data (in One Session)
Claude took raw data, ran the analysis, and produced a presentation-ready PowerPoint slide with charts and branding. What happened, and what it changed.
7 Feb 2026 · 13 min read · By Sophie Kazandjian
Update, March 2026:
Since I published this post, Claude in PowerPoint has rolled out more widely. It launched in early February as a research preview for Max, Team, and Enterprise users, and is now available in beta on all paid plans, including Pro. The add-in works on both Mac and Windows through the Microsoft Marketplace.
The workflow I described in this article uses claude.ai's file creation feature to generate a downloadable .pptx file. Claude in PowerPoint takes a different approach: it works live inside your deck, reading your slide masters, layouts, fonts, and colour scheme so that everything it generates stays on-brand without leaving PowerPoint.
As of March 11, Anthropic has also introduced shared context between its Excel and PowerPoint add-ins, meaning Claude can pull data from an open workbook and build slides from it in the same session. For anyone running a data-to-presentation workflow like the one I walked through here, that is a meaningful step forward.
Both approaches have their place. The file creation route gives you a complete .pptx you can open, review, and share on your own terms. The add-in gives you real-time collaboration inside an existing deck, which is faster when you are iterating on a live presentation. I would still recommend starting with the claude.ai workflow if you want to understand what Claude is doing at each stage before handing it more control inside PowerPoint itself.
How Claude created a branded PowerPoint slide from my data
I work with data. Quite often, the final step is turning numbers into something visual that a client can absorb in seconds. That usually means PowerPoint.
If you have ever spent an afternoon nudging text boxes, aligning bar charts, and trying to get your brand colours exactly right, you know the pain. It is one of those tasks that feels like it should be quick but never is.
Last week, I was under time pressure. I had a set of anonymised survey data to analyse across multiple groups, and I needed to pull out the key findings, identify the strongest areas of transformation, and present it all on a branded slide that could go straight into an existing client deck. The kind of task that would normally take me a full morning of spreadsheet work followed by a couple of hours of fiddling in PowerPoint.
I wanted to know how far I could push Claude for real client work: could it take the raw data and turn it into a fully editable, on‑brand PowerPoint slide in one session? A reliable “data‑to‑PowerPoint” workflow would save a lot of time. In this post I’ll walk you through exactly how I used Claude to analyse the data and generate a branded pptx slide, what still needed a human touch, and where I think it fits in everyday digital operations.
What I asked Claude to do
The project involved analysing anonymised pre- and post-programme survey responses. I needed Claude to:
Read and process multiple data files
Filter for a specific subset of respondents across separate groups
Match pre and post responses for the same individuals
Calculate percentage shifts across a five-point response scale (not just the top category, but the full distribution)
Identify the three areas showing the greatest overall transformation
Present the findings on a slide that matched an existing branded deck
I uploaded the data files and two example slides from the existing presentation so Claude could see the colour palette, typography, and layout style.
What happened when I used Claude
Claude worked through the data analysis methodically, matching responses across the pre and post datasets and producing a clear ranking of all survey areas by overall improvement.
Once we had agreed on the three strongest transformation areas, I asked Claude to mock up a slide. It first produced a React component so I could preview the layout and give feedback in real time. We went back and forth a couple of times on the visual hierarchy. My first concern was that the "before" and "after" percentages were not instantly readable. The client is busy, so the numbers needed to land without any mental effort. Claude adjusted the framing, flipping from a "negative reduction" story to a cleaner "56% to 97%" growth narrative.
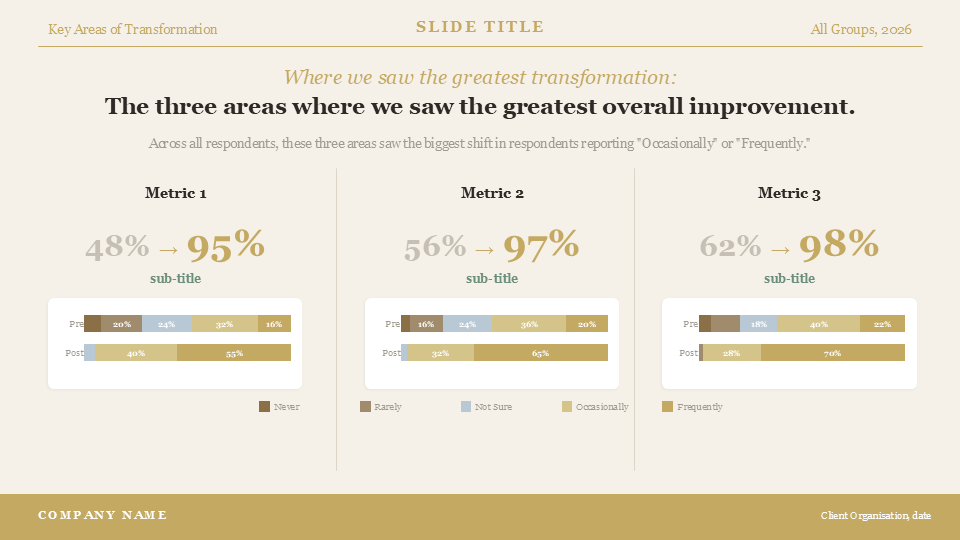
Once the layout was right, I asked for it as a PowerPoint file. Claude generated an editable .pptx with:
The correct background colour and branded gold tones
Header and footer bars matching the existing deck
Three columns, each with a large "before to after" stat
Small stacked bar charts underneath showing the full response distribution
A colour-coded legend
I opened it in PowerPoint genuinely expecting to have to redo most of it. Instead, the structure was all there. The layout, the data, the colour palette, the typography. It slotted into my deck alongside the other slides without looking out of place. That was the moment it went from "useful tool" to "wait, this actually changes how I work."
What still needed the human touch
Claude handled the heavy lifting, but it didn't replace me. There were judgement calls it could not make: which data points to emphasise for this specific audience, how much nuance to show, and where to keep things deliberately simple. I refined the key message to match the client's tone, adjusted the chart framing, and simplified some labels. The AI got me 80–90% of the way there, but the last stretch still required human judgement and knowledge of the client.
On the technical side, the small percentage labels inside the narrowest bar chart segments did not render. Anything under about 15% was too tight for the text to display. Claude gave me the full breakdown so I could add those figures manually, which took a couple of minutes. The title spacing also needed a small tweak on the first attempt, though Claude spotted the overlap during its own quality check and fixed it before I even raised it, which impressed me.
And of course, the existing deck has specific brand assets (a logo, particular font weights) that I added myself. Claude matched the colour scheme and general feel, but the final brand polish was mine.
Why this is important for my workflow
The time saving was significant. What would normally be a morning of data processing plus a couple of hours of slide design became a focused conversation. The analysis was thorough, the slide was 90% ready, and I spent my time on the last 10% of refinement rather than building from scratch.
But the bigger shift is in how the work felt. Instead of toggling between Excel, a calculator, and PowerPoint, I stayed in one conversation. I could ask questions about the data ("did the most recent cohort really outperform the others?"), get the numbers, and then say "now put that on a slide." The thinking and the production happened in the same place.
For me, this experiment confirmed that Claude is now good enough to be a practical part of a data‑to‑presentation pipeline. It does not remove the need for you, but it does mean that “I don’t have time to build the slides” becomes less of a blocker when you are under pressure.
Which version of Claude should you use?
Not all Claude plans can do this. The file creation feature (which is what generates the actual .pptx file) is available on Pro, Max, Team, and Enterprise plans. It is not available on the free tier. If you are on a free plan, you can still get Claude to build the slide as a React preview or HTML artifact, but you will not get the downloadable PowerPoint file.
For the model itself, I would recommend Claude Opus. This is the most advanced model in the Claude family, and the difference shows on tasks like this where you are asking it to hold a lot of context at once: understanding your data, remembering the brand guidelines from your uploaded slides, making design decisions, writing the code to generate the file, and then quality-checking its own output. Sonnet is faster and works well for simpler tasks, but for a multi-step workflow where accuracy and visual quality both matter, Opus handles the complexity more reliably.
The file creation feature is listed under Settings > Features as "Code Execution and File Creation" (or similar, depending on when you are reading this). Make sure it is toggled on before you start.
If you are working directly in PowerPoint rather than in claude.ai, there is now another option. Claude in PowerPoint is a new add-in (currently in research preview for Max, Team, and Enterprise plans) that lets you build and refine slides inside your existing templates. It reads your layouts, fonts, and slide masters, so every change stays on-brand without leaving PowerPoint. The approach I used in this post works through claude.ai's file creation feature, which gives you a downloadable .pptx. Claude in PowerPoint takes it further by working live inside your deck.
Why I didn’t use NotebookLM for this
I know some people are using Google's NotebookLM to generate presentations from data, and it does produce nice-looking slides. But the output is not editable. You get a flat file. If you want to change a number, adjust the wording, or swap a colour to match your brand, you are stuck. You can import the slides into Canva and try to grab individual text elements or features, but it is fiddly and imperfect. You end up rebuilding half the slide anyway.
What Claude gave me was a fully editable .pptx file. Every text box, every shape, every bar chart segment was a separate object I could click on and change. That is a meaningful difference when you are working to a client's brand standards and need to make last-minute tweaks before a meeting.
What I would recommend if you want to try this
If you want to use Claude to create on‑brand slides from your own data, start with something small and low‑risk: one survey question, one chart, one slide. Give Claude a clear brief, a clean dataset, and a real example slide so it understands your brand and layout. Ask it first to summarise the data and the story, and only then to generate the PowerPoint slide file.
Here is what worked for me:
Upload example slides. Claude matched my brand colours and layout because it could see the existing deck. Without that visual reference, you would get a generic-looking slide.
Start with a React preview. Iterating on layout is much faster when you can see the result instantly and give feedback before committing to a PowerPoint file.
Be specific about what "impact" means. I told Claude the client was busy and needed to absorb the message in seconds. That shaped the entire visual hierarchy. "Make it impactful" is too vague.
Expect to do the final polish yourself. The output is a strong, editable starting point. Small segments, brand assets, and exact font matching will still need your eye.
Once you are comfortable with the workflow, you can scale it up to more questions, more slides, or repeatable client reports. The aim is not to hand everything over to AI, but to build a repeatable “data‑to‑PowerPoint” workflow that takes care of the formatting and leaves you to do the work only you can do.
For me, this has opened up a new way of working with presentations. Not replacing the design thinking, but compressing the production time so I can focus on the story I want to tell.
FAQs:
- Which Claude plan do I need to create a PowerPoint file?
You need a paid Claude plan with the file creation feature enabled. This is available on Pro, Max, Team, and Enterprise plans, but not on the free tier. The feature is found under Settings > Features as "Code Execution and File Creation." Make sure it is toggled on before you start. On the free tier, you can still ask Claude to design the slide as a React preview, but you will not get the downloadable .pptx file.
- Which Claude model should I use for data-to-slide work?
I recommend Claude Opus for this kind of multi-step task. Opus is the most advanced model in the Claude family, and the difference shows when you are asking it to hold a lot of context: understanding your data, remembering brand guidelines from your uploaded slides, making design decisions, generating the file, and quality-checking its own output. Sonnet works well for simpler tasks but Opus is more reliable when accuracy and visual quality both matter.
- How is this different from Claude in PowerPoint?
The workflow described in this article uses Claude inside claude.ai's chat interface to generate a downloadable .pptx file. Claude in PowerPoint is a separate add-in that works live inside your existing deck, reading your slide masters, layouts, fonts, and colours so that everything stays on-brand without leaving PowerPoint. Both have their place. The chat-and-download route gives you a complete file you can review and share on your own terms. The add-in is faster when you are iterating on a live presentation. I recommend starting with the chat workflow if you want to understand what Claude is doing at each stage before handing it more control inside PowerPoint itself.
- Can Claude match my brand colours and typography?
Yes, but only if you give it visual references. Upload one or two example slides from your existing deck and Claude will pick up the colour palette, typography, and general layout style. Without that visual reference, you will get a generic-looking slide. The closer your example slides are to what you want the final output to look like, the better the match.
- Why not just use NotebookLM or Canva for this?
NotebookLM produces nice-looking slides but the output is a flat file you cannot easily edit. If you want to change a number, adjust wording, or tweak a colour to match your brand, you are stuck. Canva is similar. You can build slides there but importing data and producing branded output is fiddly. Claude gives you a fully editable .pptx file where every text box, every shape, and every chart segment is a separate object you can click and change. That matters when you are working to a client's brand standards and need last-minute tweaks.
- What still needs human judgement in this workflow?
Claude handles the technical heavy lifting: analysing the data, calculating shifts, generating the layout, producing the .pptx file. But the editorial judgement is still yours. Which data points to emphasise for this specific audience, how much nuance to show, where to keep things deliberately simple, and how the message lands for the client you actually know. These are calls Claude cannot make for you. The AI gets you 80–90 percent of the way there. The final 10 percent is where your understanding of the audience and the brand makes the difference.